There are 107,572 registered voters in SD-07. They are represented by Tyler Harper (R).
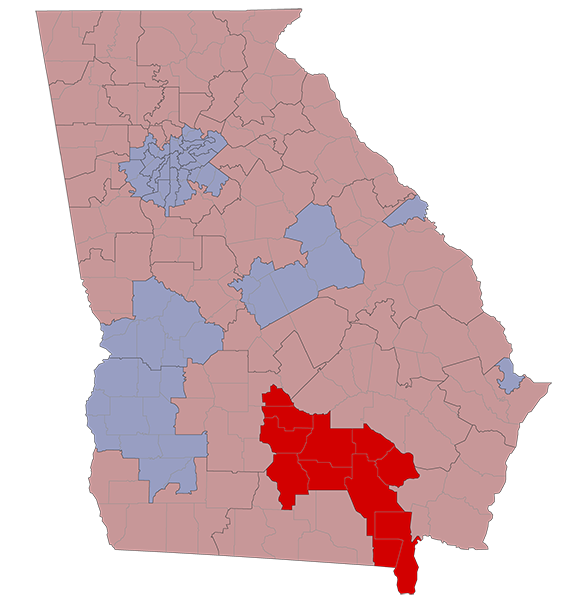
SD-07 stretches across Atkinson, Bacon, Ben Hill, Berrien, Charlton, Coffee, Irwin, Pierce, Ware, and Wilcox Counties.
2020 Election Results
Race
Nov 3
Jan 5
State Senate
Presidential
Senate
Senate Special
n/a
R +50.9%
R +51.9%
R +51.2%
R +50.3%
R +50.2%
County Voting Breakdowns
| State Sen | Pres | Senate | Sen Spec | Sen Runoff | Spec Runoff | |
|---|---|---|---|---|---|---|
| Atkinson County | 2,518 | 3,155 | 3,097 | 2,995 | 2,645 | 2,648 |
| Democrat | 0 | 825 | 773 | 752 | 720 | 722 |
| Republican | 2,518 | 2,300 | 2,272 | 2,176 | 1,925 | 1,926 |
| Third Party | 30 | 52 | 67 | |||
| Bacon County | 4,091 | 4,668 | 4,590 | 4,512 | 4,128 | 4,131 |
| Democrat | 0 | 625 | 591 | 577 | 559 | 559 |
| Republican | 4,091 | 4,018 | 3,929 | 3,880 | 3,569 | 3,572 |
| Third Party | 25 | 70 | 55 | |||
| Ben Hill County | 5,185 | 6,560 | 6,477 | 6,444 | 5,713 | 5,726 |
| Democrat | 0 | 2,392 | 2,284 | 2,304 | 2,182 | 2,193 |
| Republican | 5,185 | 4,110 | 4,077 | 4,008 | 3,531 | 3,533 |
| Third Party | 58 | 116 | 132 | |||
| Berrien County | 6,877 | 7,743 | 7,650 | 7,565 | 6,679 | 6,684 |
| Democrat | 0 | 1,269 | 1,204 | 1,191 | 1,141 | 1,145 |
| Republican | 6,877 | 6,419 | 6,286 | 6,239 | 5,538 | 5,539 |
| Third Party | 55 | 160 | 135 | |||
| Charlton County | 1,237 | 1,369 | 1,341 | 1,299 | 1,175 | 1,171 |
| Democrat | 0 | 106 | 108 | 94 | 97 | 89 |
| Republican | 1,237 | 1,254 | 1,214 | 1,171 | 1,078 | 1,082 |
| Third Party | 9 | 19 | 34 | |||
| Coffee County | 11,961 | 15,214 | 14,991 | 14,722 | 13,212 | 13,219 |
| Democrat | 0 | 4,511 | 4,281 | 4,317 | 4,058 | 4,082 |
| Republican | 11,961 | 10,578 | 10,424 | 10,148 | 9,154 | 9,137 |
| Third Party | 125 | 286 | 257 | |||
| Irwin County | 3,560 | 4,168 | 4,144 | 4,093 | 3,616 | 3,617 |
| Democrat | 0 | 1,008 | 982 | 957 | 877 | 885 |
| Republican | 3,560 | 3,134 | 3,095 | 3,077 | 2,739 | 2,732 |
| Third Party | 26 | 67 | 59 | |||
| Pierce County | 8,158 | 9,048 | 8,941 | 8,786 | 7,928 | 7,927 |
| Democrat | 0 | 1,100 | 1,002 | 991 | 956 | 947 |
| Republican | 8,158 | 7,899 | 7,810 | 7,625 | 6,972 | 6,980 |
| Third Party | 49 | 129 | 170 | |||
| Ware County | 11,629 | 14,192 | 13,979 | 13,748 | 12,202 | 12,209 |
| Democrat | 0 | 4,211 | 3,937 | 3,943 | 3,704 | 3,710 |
| Republican | 11,629 | 9,865 | 9,773 | 9,530 | 8,498 | 8,499 |
| Third Party | 116 | 269 | 275 | |||
| Wilcox County | 1,217 | 1,262 | 1,247 | 1,237 | 1,113 | 1,114 |
| Democrat | 0 | 236 | 215 | 234 | 218 | 220 |
| Republican | 1,217 | 1,019 | 1,007 | 983 | 895 | 894 |
| Third Party | 7 | 25 | 20 |
| Dem | Rep | 3P | |
|---|---|---|---|
| Atkinson Co | |||
| State Senate | 0 | 2,518 | |
| President | 825 | 2,300 | 30 |
| Senate | 773 | 2,272 | 52 |
| Sen Special | 752 | 2,176 | 67 |
| Sen Runoff | 720 | 1,925 | |
| Spec Runoff | 722 | 1,926 | |
| Bacon Co | |||
| State Senate | 0 | 4,091 | |
| President | 625 | 4,018 | 25 |
| Senate | 591 | 3,929 | 70 |
| Sen Special | 577 | 3,880 | 55 |
| Sen Runoff | 559 | 3,569 | |
| Spec Runoff | 559 | 3,572 | |
| Ben Hill Co | |||
| State Senate | 0 | 5,185 | |
| President | 2,392 | 4,110 | 58 |
| Senate | 2,284 | 4,077 | 116 |
| Sen Special | 2,304 | 4,008 | 132 |
| Sen Runoff | 2,182 | 3,531 | |
| Spec Runoff | 2,193 | 3,533 | |
| Berrien Co | |||
| State Senate | 0 | 6,877 | |
| President | 1,269 | 6,419 | 55 |
| Senate | 1,204 | 6,286 | 160 |
| Sen Special | 1,191 | 6,239 | 135 |
| Sen Runoff | 1,141 | 5,538 | |
| Spec Runoff | 1,145 | 5,539 | |
| Charlton Co | |||
| State Senate | 0 | 1,237 | |
| President | 106 | 1,254 | 9 |
| Senate | 108 | 1,214 | 19 |
| Sen Special | 94 | 1,171 | 34 |
| Sen Runoff | 97 | 1,078 | |
| Spec Runoff | 89 | 1,082 | |
| Coffee Co | |||
| State Senate | 0 | 11,961 | |
| President | 4,511 | 10,578 | 125 |
| Senate | 4,281 | 10,424 | 286 |
| Sen Special | 4,317 | 10,148 | 257 |
| Sen Runoff | 4,058 | 9,154 | |
| Spec Runoff | 4,082 | 9,137 | |
| Irwin Co | |||
| State Senate | 0 | 3,560 | |
| President | 1,008 | 3,134 | 26 |
| Senate | 982 | 3,095 | 67 |
| Sen Special | 957 | 3,077 | 59 |
| Sen Runoff | 877 | 2,739 | |
| Spec Runoff | 885 | 2,732 | |
| Pierce Co | |||
| State Senate | 0 | 8,158 | |
| President | 1,100 | 7,899 | 49 |
| Senate | 1,002 | 7,810 | 129 |
| Sen Special | 991 | 7,625 | 170 |
| Sen Runoff | 956 | 6,972 | |
| Spec Runoff | 947 | 6,980 | |
| Ware Co | |||
| State Senate | 0 | 11,629 | |
| President | 4,211 | 9,865 | 116 |
| Senate | 3,937 | 9,773 | 269 |
| Sen Special | 3,943 | 9,530 | 275 |
| Sen Runoff | 3,704 | 8,498 | |
| Spec Runoff | 3,710 | 8,499 | |
| Wilcox Co | |||
| State Senate | 0 | 1,217 | |
| President | 236 | 1,019 | 7 |
| Senate | 215 | 1,007 | 25 |
| Sen Special | 234 | 983 | 20 |
| Sen Runoff | 218 | 895 | |
| Spec Runoff | 220 | 894 |
RVs By Race
Race
RVs
% of RVs
White
Black
Hispanic
Asian
Other/Unk
75,073
22,172
2,310
481
7,536
69.8%
20.6%
2.1%
0.4%
7.0%
RVs By Gender
Gender
RVs
% of RVs
Female
Male
Unknown
57,788
49,628
156
53.7%
46.1%
0.1%
RVs By Age
Age
RVs
% of RVs
18-29
30-39
40-49
50-64
65+
24,829
26,795
16,735
17,245
21,968
23.1%
24.9%
15.6%
16.0%
20.4%