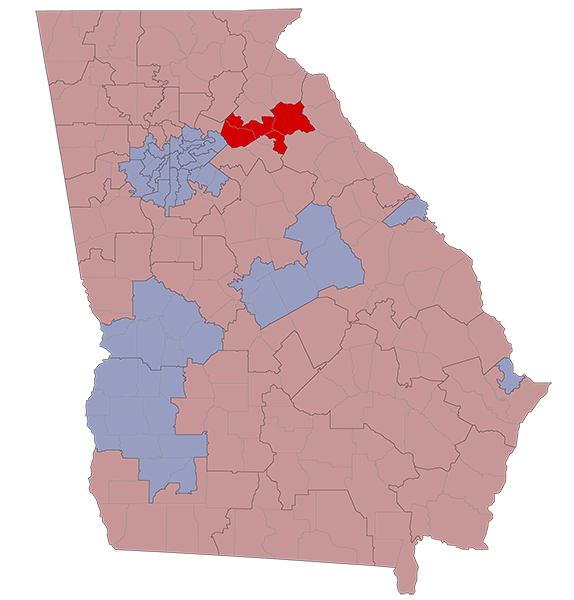
There are 144,646 registered voters in SD-47. They are represented by Frank Ginn (R).
SD-47 stretches across Barrow, Clarke, Jackson, and Madison Counties.
2020 Election Results
Race
Nov 3
Jan 5
State Senate
Presidential
Senate
Senate Special
R +31.7%
R +29.1%
R +30.0%
R +29.5%
R +27.8%
R +26.9%
County Voting Breakdowns
| State Sen | Pres | Senate | Sen Spec | Sen Runoff | Spec Runoff | |
|---|---|---|---|---|---|---|
| Barrow County | 36,786 | 37,921 | 37,576 | 37,190 | 32,065 | 32,077 |
| Democrat | 9,992 | 10,453 | 10,066 | 10,052 | 9,276 | 9,417 |
| Republican | 26,794 | 26,804 | 26,317 | 26,062 | 22,789 | 22,660 |
| Third Party | 664 | 1,193 | 1,076 | |||
| Clarke County | 20,055 | 20,452 | 20,326 | 20,232 | 18,457 | 18,458 |
| Democrat | 13,777 | 14,303 | 13,776 | 13,833 | 13,201 | 13,304 |
| Republican | 6,278 | 5,809 | 6,009 | 5,873 | 5,256 | 5,154 |
| Third Party | 340 | 541 | 526 | |||
| Jackson County | 20,250 | 20,840 | 20,678 | 20,541 | 18,079 | 18,086 |
| Democrat | 4,129 | 4,461 | 4,231 | 4,292 | 3,981 | 4,066 |
| Republican | 16,121 | 16,078 | 15,932 | 15,844 | 14,098 | 14,020 |
| Third Party | 301 | 515 | 405 | |||
| Madison County | 14,446 | 14,937 | 14,798 | 14,674 | 13,199 | 13,203 |
| Democrat | 3,357 | 3,411 | 3,303 | 3,316 | 3,074 | 3,102 |
| Republican | 11,089 | 11,326 | 11,136 | 11,077 | 10,125 | 10,101 |
| Third Party | 200 | 359 | 281 |
| Dem | Rep | 3P | |
|---|---|---|---|
| Barrow Co | |||
| State Senate | 9,992 | 26,794 | |
| President | 10,453 | 26,804 | 664 |
| Senate | 10,066 | 26,317 | 1,193 |
| Sen Special | 10,052 | 26,062 | 1,076 |
| Sen Runoff | 9,276 | 22,789 | |
| Spec Runoff | 9,417 | 22,660 | |
| Clarke Co | |||
| State Senate | 13,777 | 6,278 | |
| President | 14,303 | 5,809 | 340 |
| Senate | 13,776 | 6,009 | 541 |
| Sen Special | 13,833 | 5,873 | 526 |
| Sen Runoff | 13,201 | 5,256 | |
| Spec Runoff | 13,304 | 5,154 | |
| Jackson Co | |||
| State Senate | 4,129 | 16,121 | |
| President | 4,461 | 16,078 | 301 |
| Senate | 4,231 | 15,932 | 515 |
| Sen Special | 4,292 | 15,844 | 405 |
| Sen Runoff | 3,981 | 14,098 | |
| Spec Runoff | 4,066 | 14,020 | |
| Madison Co | |||
| State Senate | 3,357 | 11,089 | |
| President | 3,411 | 11,326 | 200 |
| Senate | 3,303 | 11,136 | 359 |
| Sen Special | 3,316 | 11,077 | 281 |
| Sen Runoff | 3,074 | 10,125 | |
| Spec Runoff | 3,102 | 10,101 |
RVs By Race
Race
RVs
% of RVs
White
Black
Hispanic
Asian
Other/Unk
100,046
20,034
6,567
2,888
15,111
69.2%
13.9%
4.5%
2.0%
10.4%
RVs By Gender
Gender
RVs
% of RVs
Female
Male
Unknown
75,361
68,977
308
52.1%
47.7%
0.2%
RVs By Age
Age
RVs
% of RVs
18-29
30-39
40-49
50-64
65+
26,923
34,327
23,006
27,063
33,327
18.6%
23.7%
15.9%
18.7%
23.0%

