There are 137,528 registered voters in SD-20. They are represented by Larry Walker, III (R).
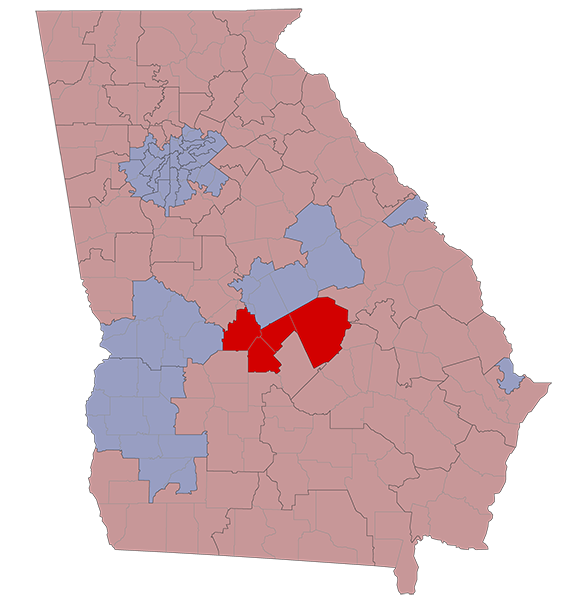
SD-20 stretches across Bleckley, Houston, Laurens, and Pulaski Counties.
2020 Election Results
Race
Nov 3
Jan 5
State Senate
Presidential
Senate
Senate Special
R +29.9%
R +24.4%
R +26.0%
R +24.9%
R +23.3%
R +22.8%
County Voting Breakdowns
| State Sen | Pres | Senate | Sen Spec | Sen Runoff | Spec Runoff | |
|---|---|---|---|---|---|---|
| Bleckley County | 5,582 | 5,706 | 5,644 | 5,613 | 5,110 | 5,112 |
| Democrat | 1,198 | 1,311 | 1,249 | 1,265 | 1,190 | 1,214 |
| Republican | 4,384 | 4,328 | 4,281 | 4,257 | 3,920 | 3,898 |
| Third Party | 67 | 114 | 91 | |||
| Houston County | 57,583 | 58,425 | 57,963 | 57,629 | 52,049 | 52,044 |
| Democrat | 21,431 | 23,223 | 22,268 | 22,508 | 21,396 | 21,498 |
| Republican | 36,152 | 34,367 | 34,362 | 33,963 | 30,653 | 30,546 |
| Third Party | 835 | 1,333 | 1,158 | |||
| Laurens County | 22,087 | 22,729 | 22,474 | 22,323 | 20,244 | 20,241 |
| Democrat | 7,492 | 8,073 | 7,698 | 7,891 | 7,389 | 7,435 |
| Republican | 14,595 | 14,493 | 14,363 | 14,137 | 12,855 | 12,806 |
| Third Party | 163 | 413 | 295 | |||
| Pulaski County | 3,951 | 4,059 | 4,005 | 3,979 | 3,682 | 3,681 |
| Democrat | 1,136 | 1,217 | 1,139 | 1,183 | 1,118 | 1,138 |
| Republican | 2,815 | 2,805 | 2,787 | 2,742 | 2,564 | 2,543 |
| Third Party | 37 | 79 | 54 |
| Dem | Rep | 3P | |
|---|---|---|---|
| Bleckley Co | |||
| State Senate | 1,198 | 4,384 | |
| President | 1,311 | 4,328 | 67 |
| Senate | 1,249 | 4,281 | 114 |
| Sen Special | 1,265 | 4,257 | 91 |
| Sen Runoff | 1,190 | 3,920 | |
| Spec Runoff | 1,214 | 3,898 | |
| Houston Co | |||
| State Senate | 21,431 | 36,152 | |
| President | 23,223 | 34,367 | 835 |
| Senate | 22,268 | 34,362 | 1,333 |
| Sen Special | 22,508 | 33,963 | 1,158 |
| Sen Runoff | 21,396 | 30,653 | |
| Spec Runoff | 21,498 | 30,546 | |
| Laurens Co | |||
| State Senate | 7,492 | 14,595 | |
| President | 8,073 | 14,493 | 163 |
| Senate | 7,698 | 14,363 | 413 |
| Sen Special | 7,891 | 14,137 | 295 |
| Sen Runoff | 7,389 | 12,855 | |
| Spec Runoff | 7,435 | 12,806 | |
| Pulaski Co | |||
| State Senate | 1,136 | 2,815 | |
| President | 1,217 | 2,805 | 37 |
| Senate | 1,139 | 2,787 | 79 |
| Sen Special | 1,183 | 2,742 | 54 |
| Sen Runoff | 1,118 | 2,564 | |
| Spec Runoff | 1,138 | 2,543 |
RVs By Race
Race
RVs
% of RVs
White
Black
Hispanic
Asian
Other/Unk
82,793
38,649
2,746
2,355
10,985
60.2%
28.1%
2.0%
1.7%
8.0%
RVs By Gender
Gender
RVs
% of RVs
Female
Male
Unknown
73,262
64,005
261
53.3%
46.5%
0.2%
RVs By Age
Age
RVs
% of RVs
18-29
30-39
40-49
50-64
65+
26,812
34,561
22,568
24,625
28,962
19.5%
25.1%
16.4%
17.9%
21.1%