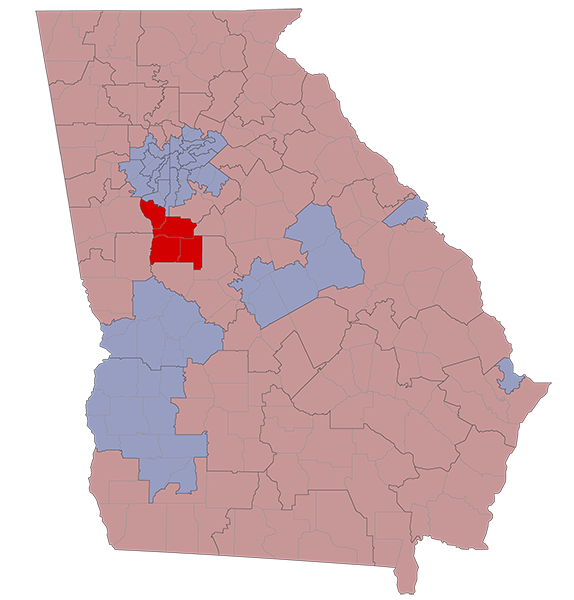
There are 143,115 registered voters in SD-16. They are represented by Marty Harbin (R).
SD-16 stretches across Fayette, Lamar, Pike, and Spalding Counties.
2020 Election Results
Race
Nov 3
Jan 5
State Senate
Presidential
Senate
Senate Special
R +36.3%
R +29.9%
R +32.1%
R +31.0%
R +30.7%
R +29.8%
County Voting Breakdowns
| State Sen | Pres | Senate | Sen Spec | Sen Runoff | Spec Runoff | |
|---|---|---|---|---|---|---|
| Fayette County | 47,976 | 49,363 | 49,040 | 48,554 | 46,229 | 46,217 |
| Democrat | 15,799 | 18,298 | 17,043 | 17,092 | 16,706 | 16,987 |
| Republican | 32,177 | 30,338 | 30,860 | 30,289 | 29,523 | 29,230 |
| Third Party | 727 | 1,137 | 1,173 | |||
| Lamar County | 8,780 | 9,039 | 8,988 | 8,943 | 7,983 | 7,986 |
| Democrat | 2,412 | 2,615 | 2,511 | 2,603 | 2,395 | 2,428 |
| Republican | 6,368 | 6,330 | 6,280 | 6,193 | 5,588 | 5,558 |
| Third Party | 94 | 197 | 147 | |||
| Pike County | 10,435 | 10,720 | 10,649 | 10,576 | 9,638 | 9,632 |
| Democrat | 1,360 | 1,505 | 1,430 | 1,476 | 1,372 | 1,391 |
| Republican | 9,075 | 9,127 | 9,045 | 8,949 | 8,266 | 8,241 |
| Third Party | 88 | 174 | 151 | |||
| Spalding County | 29,078 | 30,116 | 29,764 | 29,713 | 26,923 | 26,926 |
| Democrat | 11,072 | 11,784 | 11,355 | 11,593 | 10,966 | 11,054 |
| Republican | 18,006 | 18,057 | 17,768 | 17,619 | 15,957 | 15,872 |
| Third Party | 275 | 641 | 501 |
| Dem | Rep | 3P | |
|---|---|---|---|
| Fayette Co | |||
| State Senate | 15,799 | 32,177 | |
| President | 18,298 | 30,338 | 727 |
| Senate | 17,043 | 30,860 | 1,137 |
| Sen Special | 17,092 | 30,289 | 1,173 |
| Sen Runoff | 16,706 | 29,523 | |
| Spec Runoff | 16,987 | 29,230 | |
| Lamar Co | |||
| State Senate | 2,412 | 6,368 | |
| President | 2,615 | 6,330 | 94 |
| Senate | 2,511 | 6,280 | 197 |
| Sen Special | 2,603 | 6,193 | 147 |
| Sen Runoff | 2,395 | 5,588 | |
| Spec Runoff | 2,428 | 5,558 | |
| Pike Co | |||
| State Senate | 1,360 | 9,075 | |
| President | 1,505 | 9,127 | 88 |
| Senate | 1,430 | 9,045 | 174 |
| Sen Special | 1,476 | 8,949 | 151 |
| Sen Runoff | 1,372 | 8,266 | |
| Spec Runoff | 1,391 | 8,241 | |
| Spalding Co | |||
| State Senate | 11,072 | 18,006 | |
| President | 11,784 | 18,057 | 275 |
| Senate | 11,355 | 17,768 | 641 |
| Sen Special | 11,593 | 17,619 | 501 |
| Sen Runoff | 10,966 | 15,957 | |
| Spec Runoff | 11,054 | 15,872 |
RVs By Race
Race
RVs
% of RVs
White
Black
Hispanic
Asian
Other/Unk
95,968
27,739
3,084
2,054
14,270
67.1%
19.4%
2.2%
1.4%
10.0%
RVs By Gender
Gender
RVs
% of RVs
Female
Male
Unknown
75,421
67,436
258
52.7%
47.1%
0.2%
RVs By Age
Age
RVs
% of RVs
18-29
30-39
40-49
50-64
65+
33,054
38,328
22,161
21,190
28,382
23.1%
26.8%
15.5%
14.8%
19.8%