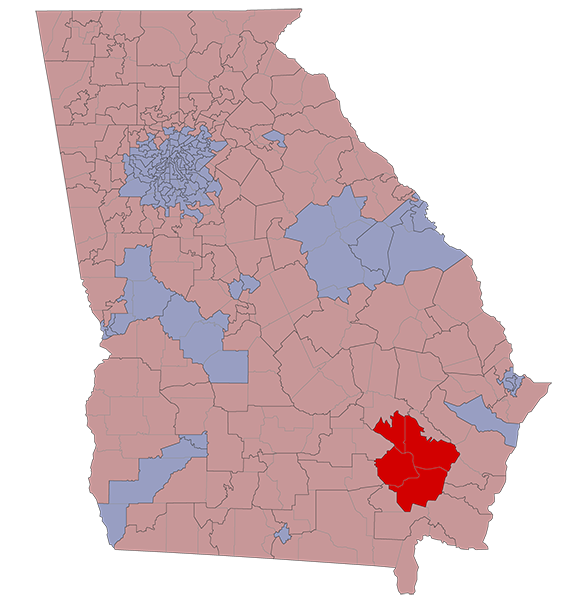
There are 35,940 registered voters in HD-178. They are represented by Steven Meeks (R).
HD-178 stretches across Appling, Brantley, Pierce, and Wayne Counties.
2020 Election Results
Race
Nov 3
Jan 5
State House
Presidential
Senate
Senate Special
n/a
R +76.4%
R +76.2%
R +76.3%
R +76.7%
R +76.8%
County Voting Breakdowns
| State House | Pres | Senate | Sen Spec | Sen Runoff | Spec Runoff | |
|---|---|---|---|---|---|---|
| Appling County | 1,829 | 2,083 | 2,062 | 2,037 | 1,865 | 1,868 |
| Democrat | 0 | 270 | 268 | 236 | 242 | 241 |
| Republican | 1,829 | 1,809 | 1,771 | 1,784 | 1,623 | 1,627 |
| Third Party | 4 | 23 | 17 | |||
| Brantley County | 6,963 | 7,746 | 7,616 | 7,388 | 6,618 | 6,612 |
| Democrat | 0 | 699 | 688 | 652 | 615 | 613 |
| Republican | 6,963 | 6,991 | 6,812 | 6,546 | 6,003 | 5,999 |
| Third Party | 56 | 116 | 190 | |||
| Pierce County | 8,181 | 9,048 | 8,941 | 8,786 | 7,928 | 7,927 |
| Democrat | 0 | 1,100 | 1,002 | 991 | 956 | 947 |
| Republican | 8,181 | 7,899 | 7,810 | 7,625 | 6,972 | 6,980 |
| Third Party | 49 | 129 | 170 | |||
| Wayne County | 5,020 | 5,548 | 5,493 | 5,413 | 4,914 | 4,914 |
| Democrat | 0 | 734 | 720 | 689 | 676 | 670 |
| Republican | 5,020 | 4,772 | 4,661 | 4,637 | 4,238 | 4,244 |
| Third Party | 42 | 112 | 87 |
| Dem | Rep | 3P | |
|---|---|---|---|
| Appling Co | |||
| State Senate | 0 | 1,829 | |
| President | 270 | 1,809 | 4 |
| Senate | 268 | 1,771 | 23 |
| Sen Special | 236 | 1,784 | 17 |
| Sen Runoff | 242 | 1,623 | |
| Spec Runoff | 241 | 1,627 | |
| Brantley Co | |||
| State Senate | 0 | 6,963 | |
| President | 699 | 6,991 | 56 |
| Senate | 688 | 6,812 | 116 |
| Sen Special | 652 | 6,546 | 190 |
| Sen Runoff | 615 | 6,003 | |
| Spec Runoff | 613 | 5,999 | |
| Pierce Co | |||
| State Senate | 0 | 8,181 | |
| President | 1,100 | 7,899 | 49 |
| Senate | 1,002 | 7,810 | 129 |
| Sen Special | 991 | 7,625 | 170 |
| Sen Runoff | 956 | 6,972 | |
| Spec Runoff | 947 | 6,980 | |
| Wayne Co | |||
| State Senate | 0 | 5,020 | |
| President | 734 | 4,772 | 42 |
| Senate | 720 | 4,661 | 112 |
| Sen Special | 689 | 4,637 | 87 |
| Sen Runoff | 676 | 4,238 | |
| Spec Runoff | 670 | 4,244 |
RVs By Race
Race
Reg Voters
% of RVs
White
Black
Hispanic
Asian
Other/Unk
30,579
2,159
344
131
2,727
85.1%
6.0%
1.0%
0.4%
7.6%
RVs By Gender
Gender
Reg Voters
% of RVs
Female
Male
Unknown
18,776
17,117
47
52.2%
47.6%
0.1%
RVs By Age
Age
Reg Voters
% of RVs
18-29
30-39
40-49
50-64
65+
8,324
9,225
5,855
5,545
6,991
23.2%
25.7%
16.3%
15.4%
19.5%

