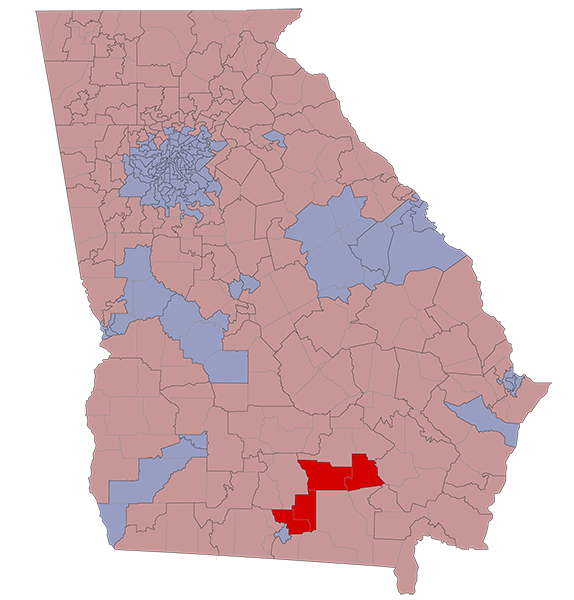
There are 36,459 registered voters in HD-176. They are represented by James Burchett (R).
HD-176 stretches across Atkinson, Lanier, Lowndes, and Ware Counties.
2020 Election Results
Race
Nov 3
Jan 5
State House
Presidential
Senate
Senate Special
R +42.3%
R +37.6%
R +39.4%
R +38.9%
R +37.1%
R +36.9%
County Voting Breakdowns
| State House | Pres | Senate | Sen Spec | Sen Runoff | Spec Runoff | |
|---|---|---|---|---|---|---|
| Atkinson County | 2,929 | 3,155 | 3,097 | 2,995 | 2,645 | 2,648 |
| Democrat | 679 | 825 | 773 | 752 | 720 | 722 |
| Republican | 2,250 | 2,300 | 2,272 | 2,176 | 1,925 | 1,926 |
| Third Party | 30 | 52 | 67 | |||
| Lanier County | 3,441 | 3,576 | 3,519 | 3,428 | 3,032 | 3,036 |
| Democrat | 911 | 1,019 | 944 | 918 | 905 | 910 |
| Republican | 2,530 | 2,509 | 2,481 | 2,409 | 2,127 | 2,126 |
| Third Party | 48 | 94 | 101 | |||
| Lowndes County | 8,111 | 8,337 | 8,251 | 8,140 | 7,172 | 7,167 |
| Democrat | 2,781 | 2,959 | 2,816 | 2,753 | 2,585 | 2,593 |
| Republican | 5,330 | 5,262 | 5,219 | 5,159 | 4,587 | 4,574 |
| Third Party | 116 | 216 | 228 | |||
| Ware County | 6,945 | 7,259 | 7,149 | 7,025 | 6,270 | 6,273 |
| Democrat | 1,814 | 2,035 | 1,883 | 1,912 | 1,800 | 1,808 |
| Republican | 5,131 | 5,173 | 5,126 | 4,983 | 4,470 | 4,465 |
| Third Party | 51 | 140 | 130 |
| Dem | Rep | 3P | |
|---|---|---|---|
| Atkinson Co | |||
| State Senate | 679 | 2,250 | |
| President | 825 | 2,300 | 30 |
| Senate | 773 | 2,272 | 52 |
| Sen Special | 752 | 2,176 | 67 |
| Sen Runoff | 720 | 1,925 | |
| Spec Runoff | 722 | 1,926 | |
| Lanier Co | |||
| State Senate | 911 | 2,530 | |
| President | 1,019 | 2,509 | 48 |
| Senate | 944 | 2,481 | 94 |
| Sen Special | 918 | 2,409 | 101 |
| Sen Runoff | 905 | 2,127 | |
| Spec Runoff | 910 | 2,126 | |
| Lowndes Co | |||
| State Senate | 2,781 | 5,330 | |
| President | 2,959 | 5,262 | 116 |
| Senate | 2,816 | 5,219 | 216 |
| Sen Special | 2,753 | 5,159 | 228 |
| Sen Runoff | 2,585 | 4,587 | |
| Spec Runoff | 2,593 | 4,574 | |
| Ware Co | |||
| State Senate | 1,814 | 5,131 | |
| President | 2,035 | 5,173 | 51 |
| Senate | 1,883 | 5,126 | 140 |
| Sen Special | 1,912 | 4,983 | 130 |
| Sen Runoff | 1,800 | 4,470 | |
| Spec Runoff | 1,808 | 4,465 |
RVs By Race
Race
Reg Voters
% of RVs
White
Black
Hispanic
Asian
Other/Unk
24,337
7,969
1,118
325
2,710
66.8%
21.9%
3.1%
0.9%
7.4%
RVs By Gender
Gender
Reg Voters
% of RVs
Female
Male
Unknown
19,533
16,875
51
53.6%
46.3%
0.1%
RVs By Age
Age
Reg Voters
% of RVs
18-29
30-39
40-49
50-64
65+
7,277
8,823
5,745
6,797
7,817
20.0%
24.2%
15.8%
18.6%
21.4%