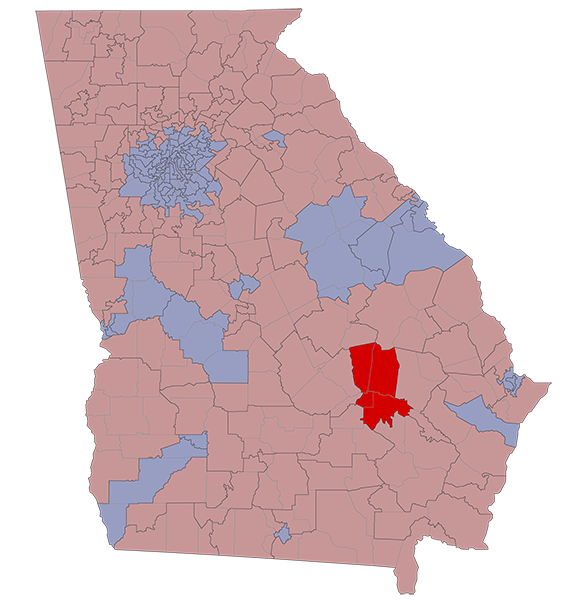
There are 34,730 registered voters in HD-156. They are represented by Greg Morris (R) - ret.
HD-156 stretches across Appling, Jeff Davis, Montgomery, and Toombs Counties.
2020 Election Results
Race
Nov 3
Jan 5
State House
Presidential
Senate
Senate Special
n/a
R +50.3%
R +50.3%
R +50.7%
R +50.5%
R +50.2%
County Voting Breakdowns
| State House | Pres | Senate | Sen Spec | Sen Runoff | Spec Runoff | |
|---|---|---|---|---|---|---|
| Appling County | 5,192 | 6,258 | 6,125 | 6,122 | 5,416 | 5,418 |
| Democrat | 0 | 1,509 | 1,485 | 1,425 | 1,356 | 1,355 |
| Republican | 5,192 | 4,717 | 4,535 | 4,612 | 4,060 | 4,063 |
| Third Party | 32 | 105 | 85 | |||
| Jeff Davis County | 1,359 | 1,482 | 1,466 | 1,442 | 1,301 | 1,297 |
| Democrat | 0 | 111 | 116 | 112 | 103 | 96 |
| Republican | 1,359 | 1,360 | 1,329 | 1,313 | 1,198 | 1,201 |
| Third Party | 11 | 21 | 17 | |||
| Montgomery County | 3,394 | 3,966 | 3,920 | 3,838 | 3,519 | 3,526 |
| Democrat | 0 | 979 | 931 | 932 | 884 | 896 |
| Republican | 3,394 | 2,960 | 2,927 | 2,844 | 2,635 | 2,630 |
| Third Party | 27 | 62 | 62 | |||
| Toombs County | 9,151 | 10,914 | 10,798 | 10,651 | 9,388 | 9,409 |
| Democrat | 0 | 2,939 | 2,832 | 2,784 | 2,511 | 2,543 |
| Republican | 9,151 | 7,872 | 7,793 | 7,674 | 6,877 | 6,866 |
| Third Party | 103 | 173 | 193 |
| Dem | Rep | 3P | |
|---|---|---|---|
| Appling Co | |||
| State Senate | 0 | 5,192 | |
| President | 1,509 | 4,717 | 32 |
| Senate | 1,485 | 4,535 | 105 |
| Sen Special | 1,425 | 4,612 | 85 |
| Sen Runoff | 1,356 | 4,060 | |
| Spec Runoff | 1,355 | 4,063 | |
| Jeff Davis Co | |||
| State Senate | 0 | 1,359 | |
| President | 111 | 1,360 | 11 |
| Senate | 116 | 1,329 | 21 |
| Sen Special | 112 | 1,313 | 17 |
| Sen Runoff | 103 | 1,198 | |
| Spec Runoff | 96 | 1,201 | |
| Montgomery Co | |||
| State Senate | 0 | 3,394 | |
| President | 979 | 2,960 | 27 |
| Senate | 931 | 2,927 | 62 |
| Sen Special | 932 | 2,844 | 62 |
| Sen Runoff | 884 | 2,635 | |
| Spec Runoff | 896 | 2,630 | |
| Toombs Co | |||
| State Senate | 0 | 9,151 | |
| President | 2,939 | 7,872 | 103 |
| Senate | 2,832 | 7,793 | 173 |
| Sen Special | 2,784 | 7,674 | 193 |
| Sen Runoff | 2,511 | 6,877 | |
| Spec Runoff | 2,543 | 6,866 |
RVs By Race
Race
Reg Voters
% of RVs
White
Black
Hispanic
Asian
Other/Unk
23,538
7,301
914
148
2,829
67.8%
21.0%
2.6%
0.4%
8.1%
RVs By Gender
Gender
Reg Voters
% of RVs
Female
Male
Unknown
18,610
16,081
39
53.6%
46.3%
0.1%
RVs By Age
Age
Reg Voters
% of RVs
18-29
30-39
40-49
50-64
65+
8,077
8,816
5,371
5,484
6,982
23.3%
25.4%
15.5%
15.8%
20.1%