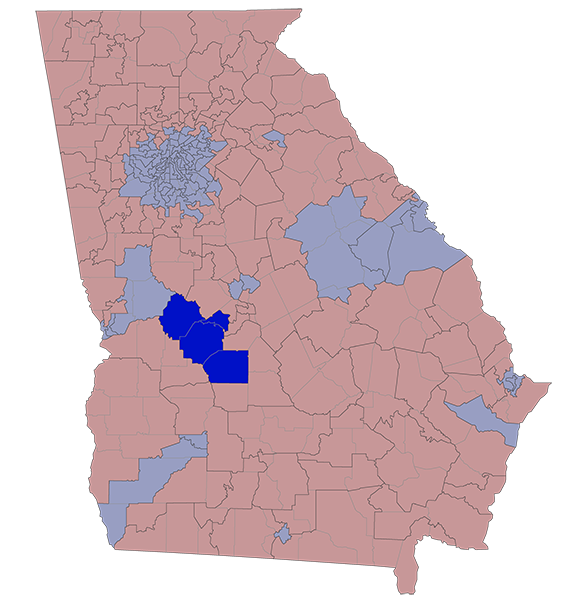
There are 28,202 registered voters in HD-139. They are represented by Patty Bentley (D).
HD-139 stretches across Dooly, Macon, Peach, and Taylor Counties.
2020 Election Results
Race
Nov 3
Jan 5
State House
Presidential
Senate
Senate Special
n/a
D +10.3%
D +7.8%
D +9.8%
D +12.6%
D +12.9%
County Voting Breakdowns
| State House | Pres | Senate | Sen Spec | Sen Runoff | Spec Runoff | |
|---|---|---|---|---|---|---|
| Dooly County | 3,106 | 4,105 | 4,059 | 4,005 | 3,740 | 3,744 |
| Democrat | 3,106 | 1,911 | 1,826 | 1,834 | 1,802 | 1,812 |
| Republican | 0 | 2,159 | 2,158 | 2,122 | 1,938 | 1,932 |
| Third Party | 35 | 75 | 49 | |||
| Macon County | 3,567 | 4,662 | 4,593 | 4,553 | 4,263 | 4,276 |
| Democrat | 3,567 | 2,857 | 2,727 | 2,755 | 2,664 | 2,685 |
| Republican | 0 | 1,783 | 1,787 | 1,743 | 1,599 | 1,591 |
| Third Party | 22 | 79 | 55 | |||
| Peach County | 4,184 | 5,081 | 5,020 | 4,988 | 4,385 | 4,387 |
| Democrat | 4,184 | 3,533 | 3,390 | 3,450 | 3,107 | 3,113 |
| Republican | 0 | 1,511 | 1,546 | 1,456 | 1,278 | 1,274 |
| Third Party | 37 | 84 | 82 | |||
| Taylor County | 2,801 | 3,839 | 3,792 | 3,769 | 3,468 | 3,473 |
| Democrat | 2,801 | 1,387 | 1,312 | 1,344 | 1,350 | 1,356 |
| Republican | 0 | 2,418 | 2,399 | 2,369 | 2,118 | 2,117 |
| Third Party | 34 | 81 | 56 |
| Dem | Rep | 3P | |
|---|---|---|---|
| Dooly Co | |||
| State Senate | 3,106 | 0 | |
| President | 1,911 | 2,159 | 35 |
| Senate | 1,826 | 2,158 | 75 |
| Sen Special | 1,834 | 2,122 | 49 |
| Sen Runoff | 1,802 | 1,938 | |
| Spec Runoff | 1,812 | 1,932 | |
| Macon Co | |||
| State Senate | 3,567 | 0 | |
| President | 2,857 | 1,783 | 22 |
| Senate | 2,727 | 1,787 | 79 |
| Sen Special | 2,755 | 1,743 | 55 |
| Sen Runoff | 2,664 | 1,599 | |
| Spec Runoff | 2,685 | 1,591 | |
| Peach Co | |||
| State Senate | 4,184 | 0 | |
| President | 3,533 | 1,511 | 37 |
| Senate | 3,390 | 1,546 | 84 |
| Sen Special | 3,450 | 1,456 | 82 |
| Sen Runoff | 3,107 | 1,278 | |
| Spec Runoff | 3,113 | 1,274 | |
| Taylor Co | |||
| State Senate | 2,801 | 0 | |
| President | 1,387 | 2,418 | 34 |
| Senate | 1,312 | 2,399 | 81 |
| Sen Special | 1,344 | 2,369 | 56 |
| Sen Runoff | 1,350 | 2,118 | |
| Spec Runoff | 1,356 | 2,117 |
RVs By Race
Race
Reg Voters
% of RVs
White
Black
Hispanic
Asian
Other/Unk
11,047
14,934
594
139
1,488
39.2%
53.0%
2.1%
0.5%
5.3%
RVs By Gender
Gender
Reg Voters
% of RVs
Female
Male
Unknown
15,144
13,028
30
53.7%
46.2%
0.1%
RVs By Age
Age
Reg Voters
% of RVs
18-29
30-39
40-49
50-64
65+
6,887
7,164
3,816
4,156
6,179
24.4%
25.4%
13.5%
14.7%
21.9%