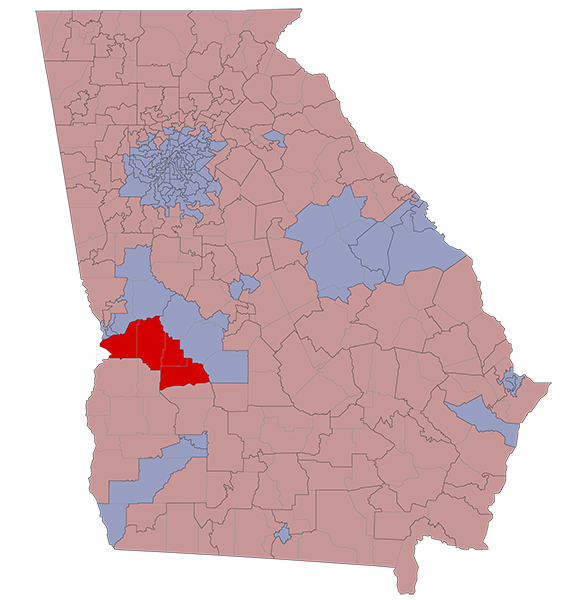
There are 28,938 registered voters in HD-138. They are represented by Mike Cheokas (R).
HD-138 stretches across Sumter, Schley, Marion, and Chattahoochee Counties.
2020 Election Results
Race
Nov 3
Jan 5
State House
Presidential
Senate
Senate Special
R +7.7%
R +8.7%
R +10.0%
R +8.7%
R +7.0%
R +6.8%
County Voting Breakdowns
| State House | Pres | Senate | Sen Spec | Sen Runoff | Spec Runoff | |
|---|---|---|---|---|---|---|
| Chattahoochee County | 1,504 | 1,582 | 1,546 | 1,534 | 1,322 | 1,321 |
| Democrat | 646 | 667 | 636 | 640 | 606 | 601 |
| Republican | 858 | 880 | 850 | 840 | 716 | 720 |
| Third Party | 35 | 60 | 54 | |||
| Marion County | 3,563 | 3,624 | 3,599 | 3,550 | 3,215 | 3,211 |
| Democrat | 1,259 | 1,311 | 1,267 | 1,269 | 1,217 | 1,217 |
| Republican | 2,304 | 2,275 | 2,248 | 2,213 | 1,998 | 1,994 |
| Third Party | 38 | 84 | 68 | |||
| Schley County | 2,249 | 2,275 | 2,256 | 2,226 | 2,058 | 2,056 |
| Democrat | 468 | 462 | 439 | 440 | 435 | 438 |
| Republican | 1,781 | 1,800 | 1,783 | 1,755 | 1,623 | 1,618 |
| Third Party | 13 | 34 | 31 | |||
| Sumter County | 10,403 | 10,506 | 10,396 | 10,376 | 9,554 | 9,558 |
| Democrat | 5,804 | 5,686 | 5,503 | 5,564 | 5,253 | 5,271 |
| Republican | 4,599 | 4,735 | 4,749 | 4,646 | 4,301 | 4,287 |
| Third Party | 85 | 144 | 166 |
| Dem | Rep | 3P | |
|---|---|---|---|
| Chattahoochee Co | |||
| State Senate | 646 | 858 | |
| President | 667 | 880 | 35 |
| Senate | 636 | 850 | 60 |
| Sen Special | 640 | 840 | 54 |
| Sen Runoff | 606 | 716 | |
| Spec Runoff | 601 | 720 | |
| Marion Co | |||
| State Senate | 1,259 | 2,304 | |
| President | 1,311 | 2,275 | 38 |
| Senate | 1,267 | 2,248 | 84 |
| Sen Special | 1,269 | 2,213 | 68 |
| Sen Runoff | 1,217 | 1,998 | |
| Spec Runoff | 1,217 | 1,994 | |
| Schley Co | |||
| State Senate | 468 | 1,781 | |
| President | 462 | 1,800 | 13 |
| Senate | 439 | 1,783 | 34 |
| Sen Special | 440 | 1,755 | 31 |
| Sen Runoff | 435 | 1,623 | |
| Spec Runoff | 438 | 1,618 | |
| Sumter Co | |||
| State Senate | 5,804 | 4,599 | |
| President | 5,686 | 4,735 | 85 |
| Senate | 5,503 | 4,749 | 144 |
| Sen Special | 5,564 | 4,646 | 166 |
| Sen Runoff | 5,253 | 4,301 | |
| Spec Runoff | 5,271 | 4,287 |
RVs By Race
Race
Reg Voters
% of RVs
White
Black
Hispanic
Asian
Other/Unk
14,822
11,281
687
275
1,873
51.2%
39.0%
2.4%
1.0%
6.5%
RVs By Gender
Gender
Reg Voters
% of RVs
Female
Male
Unknown
15,628
13,271
39
54.0%
45.9%
0.1%
RVs By Age
Age
Reg Voters
% of RVs
18-29
30-39
40-49
50-64
65+
6,223
6,926
4,238
4,916
6,635
21.5%
23.9%
14.6%
17.0%
22.9%