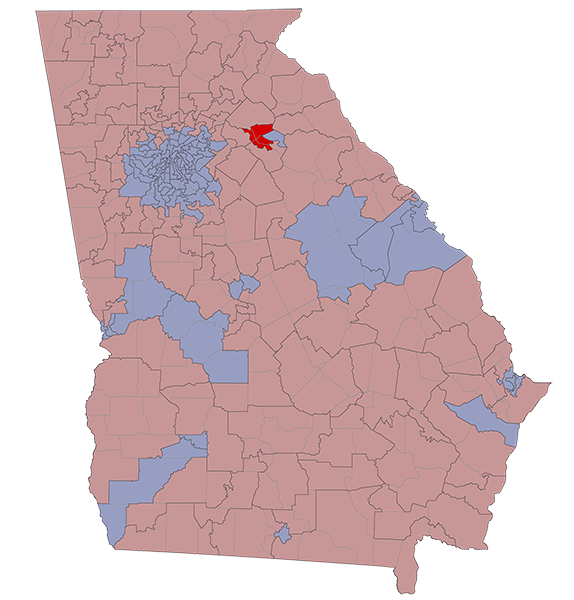
There are 44,753 registered voters in HD-117. They are represented by Houston Gaines (R).
HD-117 stretches across Barrow, Clarke, Jackson, and Oconee Counties.
2020 Election Results
Race
Nov 3
Jan 5
State House
Presidential
Senate
Senate Special
R +13.2%
R +0.3%
R +3.8%
R +3.3%
R +2.0%
R +0.8%
County Voting Breakdowns
| State House | Pres | Senate | Sen Spec | Sen Runoff | Spec Runoff | |
|---|---|---|---|---|---|---|
| Barrow County | 3,057 | 2,940 | 2,916 | 2,893 | 2,566 | 2,570 |
| Democrat | 814 | 892 | 853 | 855 | 807 | 822 |
| Republican | 2,243 | 2,008 | 1,975 | 1,960 | 1,759 | 1,748 |
| Third Party | 40 | 88 | 78 | |||
| Clarke County | 15,701 | 15,996 | 15,869 | 15,813 | 14,356 | 14,331 |
| Democrat | 9,166 | 10,244 | 9,781 | 9,762 | 9,234 | 9,325 |
| Republican | 6,535 | 5,475 | 5,673 | 5,655 | 5,122 | 5,006 |
| Third Party | 277 | 415 | 396 | |||
| Jackson County | 3,590 | 3,663 | 3,635 | 3,624 | 3,192 | 3,196 |
| Democrat | 885 | 995 | 958 | 971 | 916 | 928 |
| Republican | 2,705 | 2,616 | 2,594 | 2,587 | 2,276 | 2,268 |
| Third Party | 52 | 83 | 66 | |||
| Oconee County | 7,455 | 7,489 | 7,494 | 7,431 | 7,017 | 7,016 |
| Democrat | 2,075 | 2,625 | 2,421 | 2,461 | 2,334 | 2,379 |
| Republican | 5,380 | 4,733 | 4,909 | 4,818 | 4,683 | 4,637 |
| Third Party | 131 | 164 | 152 |
| Dem | Rep | 3P | |
|---|---|---|---|
| Barrow Co | |||
| State Senate | 814 | 2,243 | |
| President | 892 | 2,008 | 40 |
| Senate | 853 | 1,975 | 88 |
| Sen Special | 855 | 1,960 | 78 |
| Sen Runoff | 807 | 1,759 | |
| Spec Runoff | 822 | 1,748 | |
| Clarke Co | |||
| State Senate | 9,166 | 6,535 | |
| President | 10,244 | 5,475 | 277 |
| Senate | 9,781 | 5,673 | 415 |
| Sen Special | 9,762 | 5,655 | 396 |
| Sen Runoff | 9,234 | 5,122 | |
| Spec Runoff | 9,325 | 5,006 | |
| Jackson Co | |||
| State Senate | 885 | 2,705 | |
| President | 995 | 2,616 | 52 |
| Senate | 958 | 2,594 | 83 |
| Sen Special | 971 | 2,587 | 66 |
| Sen Runoff | 916 | 2,276 | |
| Spec Runoff | 928 | 2,268 | |
| Oconee Co | |||
| State Senate | 2,075 | 5,380 | |
| President | 2,625 | 4,733 | 131 |
| Senate | 2,421 | 4,909 | 164 |
| Sen Special | 2,461 | 4,818 | 152 |
| Sen Runoff | 2,334 | 4,683 | |
| Spec Runoff | 2,379 | 4,637 |
RVs By Race
Race
Reg Voters
% of RVs
White
Black
Hispanic
Asian
Other/Unk
30,571
7,079
1,406
974
4,723
68.3%
15.8%
3.1%
2.2%
10.6%
RVs By Gender
Gender
Reg Voters
% of RVs
Female
Male
Unknown
23,621
21,031
101
52.8%
47.0%
0.2%
RVs By Age
Age
Reg Voters
% of RVs
18-29
30-39
40-49
50-64
65+
9,221
9,819
6,950
8,295
10,468
20.6%
21.9%
15.5%
18.5%
23.4%